

During an ILS approach, the pilot monitors not only the runway centerline and glide path, but also the airspeed, vertical speed, and the aircraft’s correction trend. Therefore, assessing whether an approach is stabilized based on a single deviation value is not always sufficient. Artificial intelligence can jointly evaluate multiple flight and navigation parameters to classify both the type of deviation and how it develops over time.
ILS and DDM: Essential Fundamentals
The Instrument Landing System (ILS) is a ground-based precision approach system that provides lateral guidance relative to the runway centerline and vertical guidance relative to the nominal glide path. The localizer provides lateral guidance, while the glide slope provides vertical guidance. The corresponding DDM values numerically represent the aircraft’s lateral and vertical deviations from the desired approach path.
An example layout of the ground stations around the runway is shown in Figure 1 [1], [5].
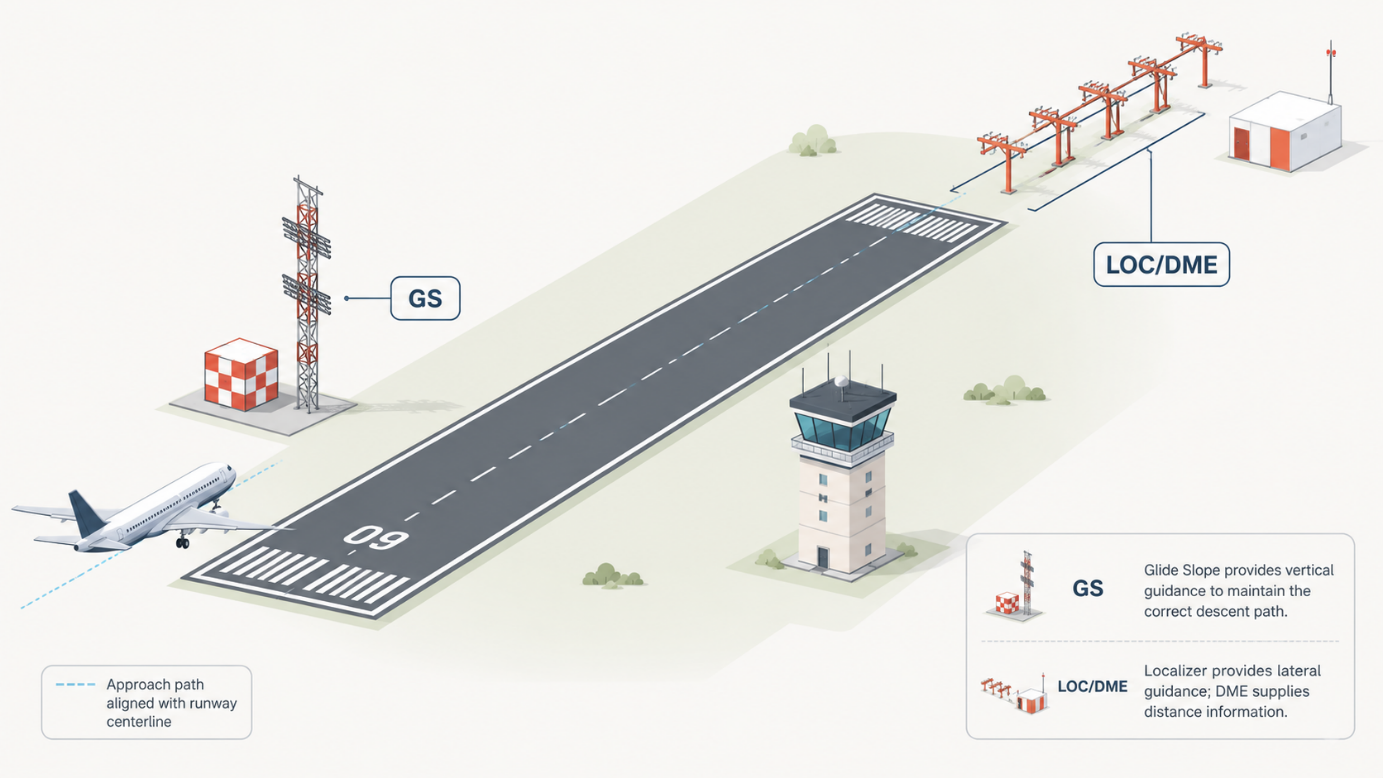
The ILS receiver calculates the Difference in Depth of Modulation (DDM) from the difference between the modulation depths of the 90 Hz and 150 Hz components. A DDM value approaching zero indicates convergence toward the desired guidance path, while its sign indicates the direction of the deviation. For this study, the key point is not the detailed frequency characteristics, but rather that the localizer and glide slope DDM values produced by the receiver provide a numerical representation of the approach geometry.
Classification Problem
Rather than classifying a single instantaneous measurement, the proposed system evaluates the behavior of the approach over a short time window. The primary output classes can be defined as follows:
| Class | Indicating Characteristics | Comment |
|---|---|---|
| Normal Approach | DDM values are near zero and stable within a narrow band | Stable Approach |
| Localizer Deviation | DDM_LOC shows a consistent deviation away from zero | Lateral Course Deviation |
| Glide Slope Deviation | DDM_GS shows a consistent deviation away from zero | Vertical Path Deviation |
| High-Energy Approach | Localizer and glide slope DDM values may remain normal, while airspeed and/or descent rate exceed the expected approach profile. | Geometrically aligned but energetically unstable. |
| Signal Anomaly | Abrupt or physically inconsistent changes in DDM relative to aircraft motion, validity flags, or other navigation data. | Potential signal, receiver, synchronization, or data-validity issue. |
Table 1: ILS Approach Condition Classes and Their Diagnostic Indicators
Random Forest: Foundational Concepts
Random Forest is a supervised machine-learning algorithm that combines the predictions of multiple decision trees. Instead of relying on a single tree, each tree is trained on a bootstrap sample of the training data, while a random subset of candidate features is evaluated at each split. This diversity reduces the risk of overfitting and improves the model’s ability to generalize to previously unseen data [2].
Each decision tree evaluates the input feature vector through a sequence of rule-based splits. For ILS approach classification, these inputs may include localizer and glide slope DDM statistics, airspeed, vertical speed, aircraft attitude, zero-crossing count, deviation trend, and overshoot magnitude.
The main stages of a Random Forest classifier are:
- Input features: Numerical parameters extracted from a sliding time window.
- Decision trees: Multiple trees independently evaluate different combinations of the features.
- Majority voting: Each tree predicts an approach-condition class, and the final class is determined by the combined votes.
- Class probabilities: The proportion of trees voting for each class can be used as an initial confidence measure.
For example, if most trees identify an increasing localizer DDM trend together with repeated zero crossings and a large overshoot, the approach may be classified as a localizer deviation. If the DDM values remain close to zero but airspeed and vertical speed exceed the expected approach profile, the model may classify the condition as a high-energy approach.
Random Forest is particularly suitable for the initial prototype because it performs effectively on tabular flight data, can capture nonlinear relationships, requires relatively limited computational resources, and provides feature-importance information that helps explain which parameters influence the classification decision.
Proposed Artificial Intelligence Method
The proposed method consists of two main stages: model development and real-time classification.
1. Data Preparation and Labelling
Each approach is labelled as one of the following classes: normal approach, localizer deviation, glide slope deviation, high-energy approach, or signal anomaly. The training and test datasets should be separated by flight or approach rather than by randomly splitting individual rows. This prevents similar samples from the same approach from appearing in both the training and test sets and producing artificially high performance results.
2. Sliding Time Window
Instead of using a single measurement, the model receives a sliding time window containing the most recent (N) samples. This window enables the model to capture the direction and growth trend of a deviation. For example, with data sampled at 10 Hz, a two-second window contains 20 consecutive measurements.
3. Feature Extraction
For each time window, derived features are calculated in addition to the raw measurements. The main features include the mean localizer and glide slope DDM values, maximum absolute deviation, rate of change, standard deviation, number of zero crossings, duration at full-scale deviation, and maximum overshoot. Changes in airspeed, vertical speed, roll, and pitch are also summarized within the same time window.
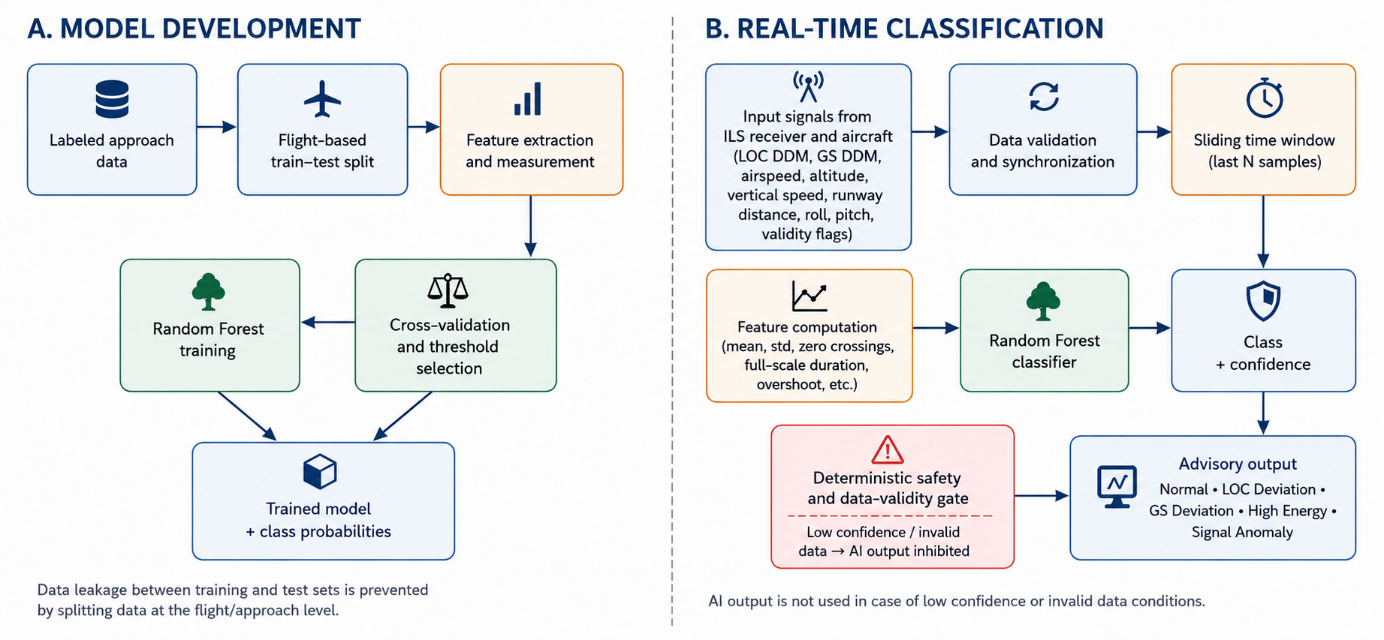
4. Model Training and Evaluation
The Random Forest model learns the decision boundaries between classes using the extracted features. The number of trees, maximum tree depth, and class weights can be tuned through cross-validation. Model evaluation should not rely solely on overall accuracy; precision, recall, F1-score, and the confusion matrix should be examined for each class. In particular, safety-critical deviations that are incorrectly classified as normal, namely false negatives, should be analyzed separately.
5. Confidence Level and Unknown Conditions
The model produces a class probability for each decision. When required, these probabilities can be calibrated and used as confidence scores. If the highest probability remains below a predefined threshold, the system should return an “unable to classify reliably” output rather than forcing the input into one of the existing classes. This behavior is especially important for combined, unusual, or previously unseen conditions that are not represented in the training dataset.
Although confidence-based rejection reduces forced classifications, it does not by itself guarantee the detection of all previously unseen or out-of-distribution conditions.
Onboard Use and Safety Boundaries
The AI model does not replace the ILS receiver. Instead, it serves as an additional monitoring layer that uses the DDM and validity data generated by the ILS receiver together with complementary information from systems such as the Air Data Computer, EGI, and radio altimeter. Its outputs may be used for pilot alerting, flight-test analysis, or post-flight event classification.
An independent deterministic safety logic should monitor the DDM limits, approach speed, data validity, and model confidence level. The AI output should not be used if the input data is invalid, the confidence score is low, or the AI prediction conflicts with rule-based checks. This architecture is consistent with EASA’s human-centric approach to AI in aviation [3]. Deterministic safety functions should be developed and verified using established airborne software-assurance processes, such as those defined in DO-178C [4].
Data Generation and Implementation Steps
The initial dataset can be generated synthetically by defining the aircraft’s runway-relative position and approach geometry. Localizer and glide slope DDM values can then be calculated, followed by the introduction of wind effects, sensor noise, speed variations, and pilot corrections. In the next stage, the synthetic dataset can be enriched with time-series data obtained from X-Plane or a similar flight simulator.
The model should first be evaluated using recorded data. When progressing toward real-flight use, it should initially operate in shadow mode, producing predictions without intervening in the aircraft systems.
Conclusion
The most meaningful approach to ILS approach-condition classification is to evaluate localizer and glide slope DDM values together with aircraft-state data and their evolution over time. A sliding time window, feature extraction, and Random Forest-based classification provide a fast, interpretable, and practical initial method. The system can distinguish between a normal approach, lateral and vertical deviations, a high-energy approach, and signal anomalies.
However, artificial intelligence should not be used as the direct flight-control authority. It should function as a monitoring and decision-support capability operating under the supervision of verified deterministic safety logic. Accordingly, the proposed architecture combines the pattern-recognition capability of machine learning with the predictable behavior of deterministic avionics logic.
References
- [1] International Civil Aviation Organization, Annex 10 to the Convention on International Civil Aviation, Volume I—Radio Navigation Aids, 6th ed. Montreal, QC, Canada: ICAO, 2006.
- [2] L. Breiman, “Random forests,” Machine Learning, vol. 45, no. 1, pp. 5–32, Oct. 2001.
- [3] European Union Aviation Safety Agency, Artificial Intelligence Roadmap 2.0: A Human-Centric Approach to AI in Aviation. Cologne, Germany: EASA, 2023.
- [4] RTCA, Software Considerations in Airborne Systems and Equipment Certification, RTCA DO-178C, Washington, DC, USA, 2011.
- [5] Federal Aviation Administration, Instrument Procedures Handbook. Washington, DC, USA: FAA, 2017.