Network devices (such as switches, routers, firewalls) and IP-based systems (such as UPS, servers, and cameras) are core components of modern IT and security infrastructures. Continuous monitoring of their fault, alarm, and performance states is critical for service continuity, security, and operational efficiency.
This reality is highly visible in our daily research operations. At VISTA Lab, training advanced deep learning models requires a robust hardware infrastructure, particularly high-performance GPU servers. To ensure uninterrupted research and prevent hardware bottlenecks, we rely on a continuous and scalable monitoring ecosystem. Furthermore, our AI-driven anomaly detection projects often require ingesting real-time data from various IoT devices. The architecture described below forms the backbone of both our internal server monitoring and our dynamic data collection pipelines.
Traditionally, this monitoring is performed via SNMP (Simple Network Management Protocol). However, today it is not sufficient to simply collect raw data. This data must be centrally aggregated, stored as time-series data, transformed into meaningful visualizations, and supported by alerting mechanisms. Moreover, in environments with hundreds or even thousands of devices, collecting data at frequent intervals (e.g., every 30 seconds or 1 minute) significantly increases data volume and introduces architectural challenges.
This is where modern monitoring tools come into play. In this article, we will answer the following questions in detail:
- What is SNMP and how does it work?
- How does Prometheus collect data?
- Why and how should we write our own exporter instead of using a ready-made SNMP exporter?
- How can we create dashboards with Grafana and embed them into applications?
What is SNMP?
SNMP (Simple Network Management Protocol) is a standard protocol used to retrieve status information from network devices and IP-based systems. It has been widely used in the networking world for many years and is a mature technology. SNMP typically provides metrics such as CPU usage, RAM usage, interface traffic (in/out), temperature, fan status, power supply status, and device uptime.
SNMP operates using an OID (Object Identifier) structure. Each metric is represented by a hierarchical numeric identifier. For example:
1.3.6.1.2.1.1.3.0 → sysUpTime
This OID represents how long the device has been running.
What is a MIB File?
Each vendor provides a MIB (Management Information Base) file that defines the OIDs available on their devices. A MIB file typically includes the OID number (numeric or named), description, data type, and possible values.
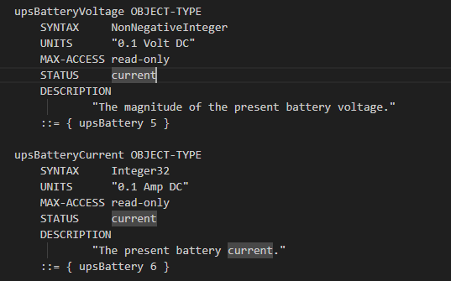
For example, a firewall vendor may provide CPU usage not through standard OIDs but through its own private OID tree. Without adding the relevant MIB file, it is not possible to correctly interpret this data. The fundamental limitation of SNMP is: It provides data, but not in the format required by modern monitoring systems.
Prometheus and the Pull Model
Prometheus is an open-source monitoring system that collects and stores time-series data. It is supported by the CNCF (Cloud Native Computing Foundation) and is widely used in microservice architectures. One of its key features is its pull-based model.
In this model, an Exporter produces metrics, and Prometheus periodically pulls data from these exporters. A data source exposes metrics via a /metrics HTTP endpoint in Prometheus format. Prometheus periodically sends HTTP requests to this endpoint and collects the data.
Why Can’t Prometheus Directly Use SNMP?
Prometheus does not natively support SNMP because SNMP is UDP-based while Prometheus is HTTP-based, and SNMP data is not in Prometheus format. Therefore, an SNMP Exporter is used as an intermediary which connects to the device via SNMP, collects OIDs, converts them into Prometheus format, and exposes them via the /metrics endpoint.
Why Should We Write Our Own Exporter?
There is a well-established open-source SNMP exporter available. However, in some cases, ready-made solutions are not sufficient:
- The device does not support SNMP.
- Required data is not exposed via SNMP.
- We want to monitor internal application states.
- We need system-level data (e.g., Windows service status).
- Data must be collected via specific APIs.
In such cases, writing a custom exporter provides much greater flexibility. Examples include monitoring the status of a video management software service, the queue length of a custom analytics application, or data received from a custom IoT device via a serial port.
Writing a Simple Exporter in Python
In this example, we expose the status of a Windows service to Prometheus. We will use Flask to create the HTTP endpoint and psutil to retrieve Windows service information.
from flask import Flask, Response
import psutil
import os
app = Flask(__name__)
SERVICE_NAME = "iphlpsvc"
def get_service_status(service_name):
try:
service = psutil.win_service_get(service_name)
service = service.as_dict()
if service['status'] == 'running':
return 1
else:
return 0
except Exception:
return 0
@app.route("/metrics")
def metrics():
status = get_service_status(SERVICE_NAME)
output = f"""
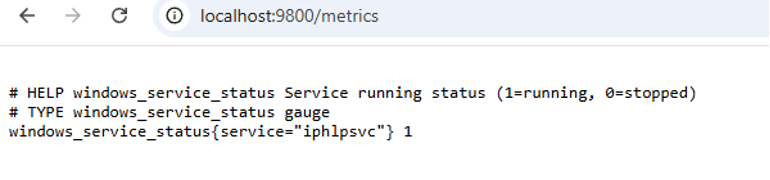
# HELP windows_service_status Service running status (1=running, 0=stopped)
# TYPE windows_service_status gauge
windows_service_status{{service="{SERVICE_NAME}"}} {status}
"""
return Response(output, mimetype="text/plain")
if __name__ == "__main__":
port = int(os.environ.get("PORT", 9800))
app.run(host="0.0.0.0", port=port)
You can test the metric by opening http://<DEVICE_IP>:9800/metrics in your browser.
Devices on which custom exporters are installed are added to the Prometheus configuration file (prometheus.yml) as shown below in order to monitor them:
scrape_configs:
  - job_name: 'windows_service'
    static_configs:
      - targets: ['192.168.1.50:9800']
The relevant Python code can be converted into an executable using PyInstaller and distributed to target devices in a simple “run-and-use” manner. Data from each deployed device can then be collected centrally through a Prometheus database.
Common Open-Source Exporters:
- Node Exporter (Linux system metrics)
- Windows Exporter
- SNMP Exporter
- Blackbox Exporter (ping, HTTP checks)
- MySQL Exporter
- PostgreSQL Exporter
Visualization of Prometheus Data with Grafana
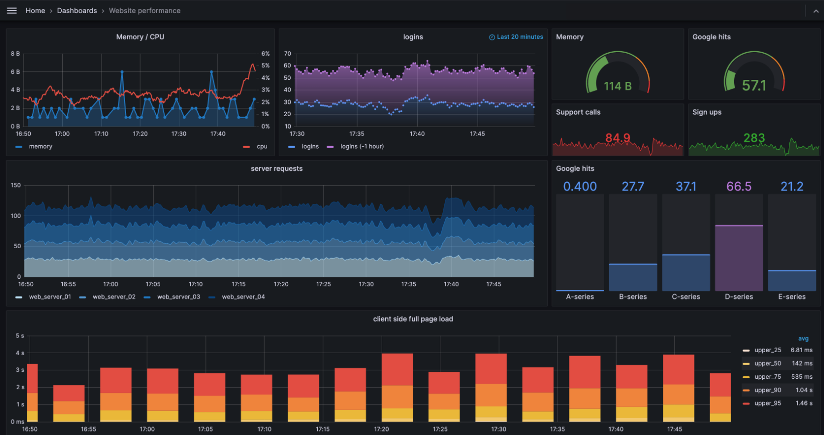
Grafana is an open-source software that integrates with many databases and enables data visualization through graphs, tables, and similar methods. After collecting data with Prometheus, the next step is to visualize this data in a meaningful way.
It is also possible to generate alerts based on thresholds or custom rules defined on the data by using supporting components such as Alertmanager, webhooks, and similar tools. Prometheus can be configured as a data source in Grafana by simply entering its URL, and various dashboards can be created using this data source.
After setting up the monitoring infrastructure, a common requirement may arise: “Instead of displaying Grafana dashboards (graphs, tables, etc.) on a separate screen, we want them to appear within our own application interface.” In such cases, Grafana provides the ability to share each dashboard via a link, allowing it to be embedded into other software interfaces using methods such as iframe or reverse proxy.
Using the methods described above, a complete monitoring infrastructure can be established. A well-designed monitoring system enables a proactive approach to failures—especially in large-scale systems—reduces response times, and lowers operational costs.